How to add the indicator

to your chart

Create a TradingView account at https://www.tradingview.com/

step 1


Go to the TradingView homepage and search your favourite trading pair in the search bar. For our example, we will choose BTC/USDT.

Select ‘Launch Chart’.

step 2

Screenshot of a cryptocurrency trading platform showing a list of BTC/USDT trading pairs and related data, with a focus on Bitcoin/Tether.

Once you can see your chosen price chart, select the indicators button at the top.

step 3

A Bitcoin price chart showing fluctuations from 2020 to 2023. A large green arrow points to a peak around mid-2021. Indicators and tools are displayed on the chart.

In the indicator pop up menu, select ‘Invite-only’.

step 4

Screenshot of a cryptocurrency trading platform showing a Bitcoin (BTC) chart with an overlay menu for indicators, metrics, and strategies. A green highlight surrounds a lock icon labeled 'Invite-only,' with a large green arrow pointing to it.

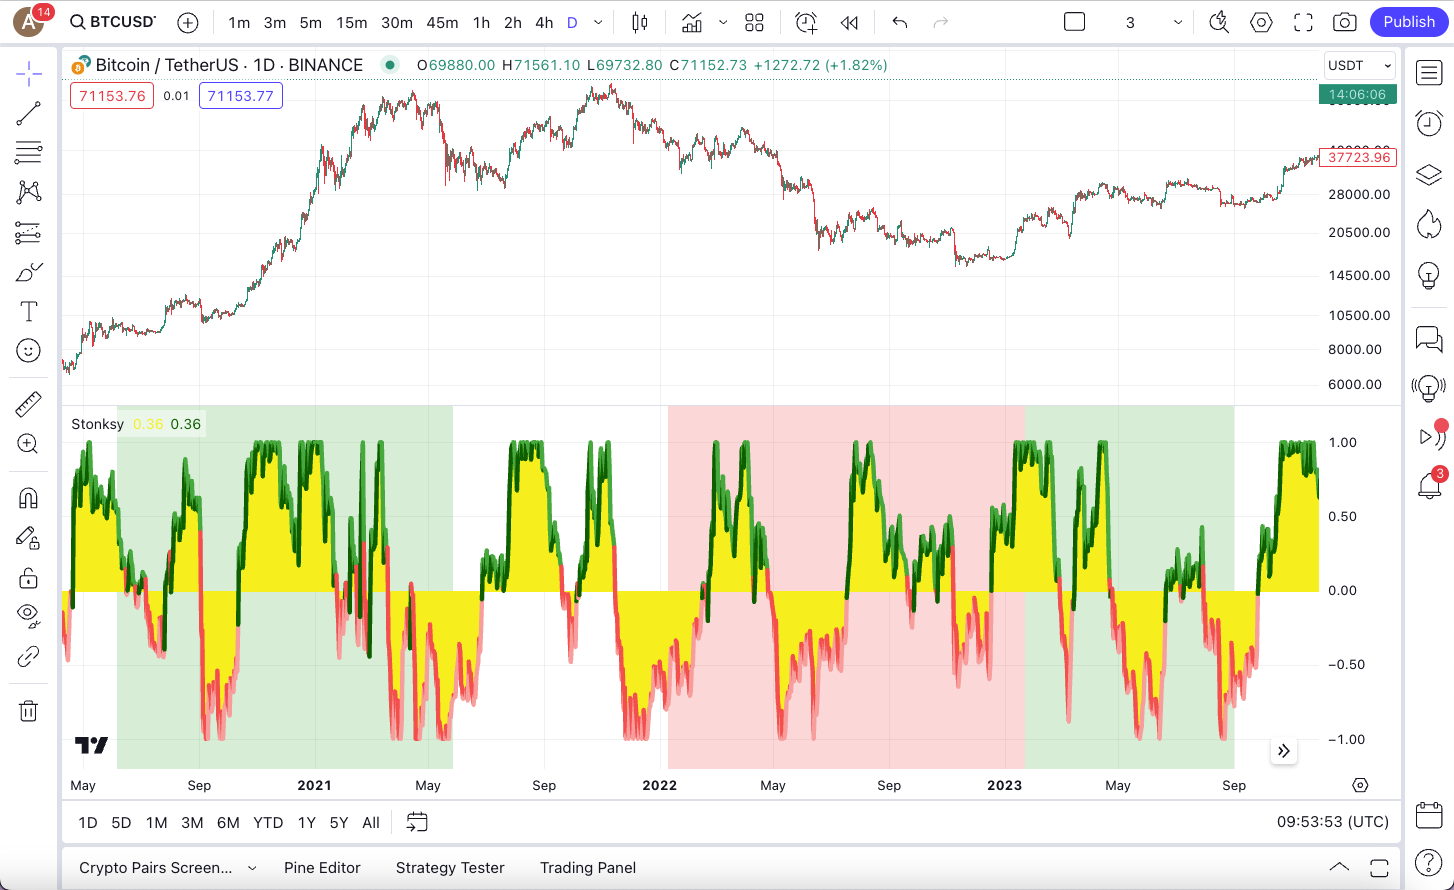
Here you can see the Stonksy indicator. Select it and then close the indicators panel.

step 5

A cryptocurrency trading chart on a trading platform with a popup menu showing a user named 'Stonksy' selected. The chart displays Bitcoin to US Dollar price movements over time, with a large green arrow pointing to the selected user profile.

Now you have the Stonksy indicator on your price chart providing you with valuable insights which can be combined with your own analysis, helping you to make more informed trading decisions!

step 6

A Bitcoin price chart showing daily price movements over time, with an additional indicator below displaying market signals using green, yellow, and red color coding for trading activity.